In this tutorial, you will learn how to use Sitecore Glimpse to debug Sitecore issues. If you are currently encountering a page performance issue within your Sitecore CMS-powered website, or some other strange random bug, having access to useful debugging information can help you resolve an issue much quicker. Being able to resolve mission-critical bugs quickly will make you a legend at work.
This is where a debugging tool called Glimpse can help you. If you've never come across Glimpse before, it's a .NET package kind of like Chrome's developer toolkit designed for server-side debugging. A guy called Kevin Obee has extended Glimpse to include extra Sitecore specific data, this package is Sitecore Glimpse. If you want to learn what capabilities this extension can offer you within your Sitecore project and how you can get up and running with it, this is the tutorial for you 🔥🔥🔥
What Is Sitecore Glimpse?
Sitecore Glimpse provides runtime web diagnostics for websites showing you the inner workings of how your application works. When Glimpse is enabled, on each page request Glimpse gathers detailed diagnostic information and sends that data back to the client (your browser) as JSON. You can access this data on the page to trace what code was triggered during that request. This tracing ability is the reason why it is a must-have tool if you need to do any performance investigation or troubleshooting within a Sitecore website.
You can install Sitecore.Glimpse via NuGet. In Visual Studio, right-click on your solution in Solution Explorer and select Manage Nuget Packages for Solution.
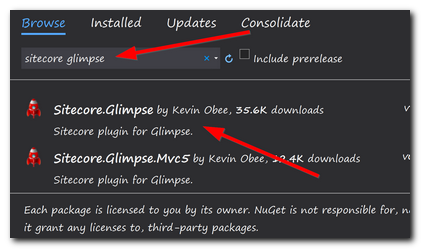
In NuGet, search for Sitecore.Glimpse and install it within your web project.
Configuring Sitecore.Glimpse
After installing Glimpse you will need to enable it. This is done within a web browser by adding Glimpse.axd to the end of your Sitecore instance Url, like so:
When I first tried setting Sitecore Glimpse up and running that URL, I encountered this 500.19 error:
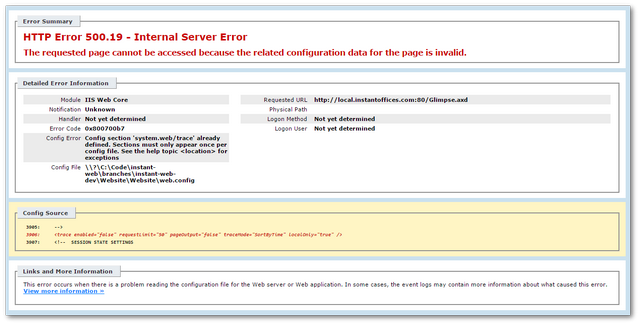
This occurred due to a web.config misconfiguration. If you encounter this error, do a search for trace within your web.config . Delete that line and replace it with this one:
After applying this change, Sitecodew Glimpse should now load:
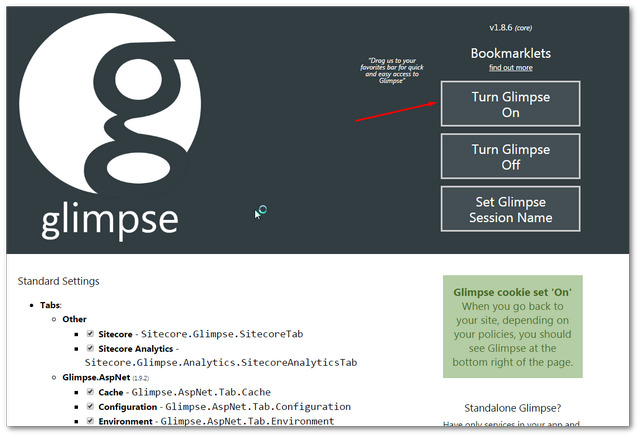
To enable Glimpse within your pages, click on the big Turn Glimpse On button. With Sitecore Glimpse configured and ready to start debugging, visit a page on your site. If everything has gone according to plan, after your web page loads you should see a little button on the bottom left of the page:
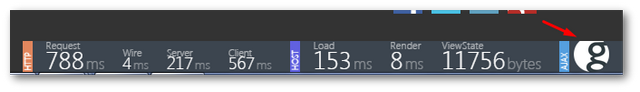
If you click on the giant G, a Chrome style developer toolbar will become visible:
Most of the options within the toolkit are vanilla Glimpse tools, however, hou should also see two Sitecore specific tabs:
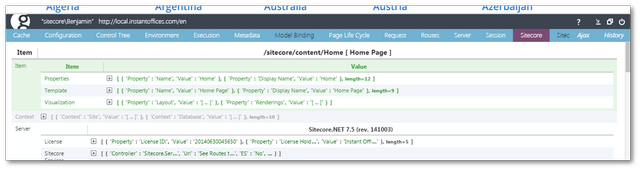
Sitecore: The Sitecore tab contains information like the current Sitecore item, from here you can see all the properties that make up the page, the properties, and values for each property. Other information Sitecore Glimpse displays include what template has been used, license information, current user information, and IIS hosting details
Sitecore Analytics: This tab displays information gathered by the Sitecore Experience Platform. If you don't have Sitecore Experience Platform enabled, this tab will be disabled.
Using these tabs, you should now get a much better understanding of what code has been called during the page request and what data has been returned. This should allow you to troubleshoot issues lightening fast ⚡⚡⚡
You should now be able to resolve Sitecore issues a lot quicker. WIth your new time, go to the pub and have a beer 😉. Happy Coding 🤘