In this tutorial, you will learn about a few very useful Visual Studio debugging tips. Every developer has been there. Hours deep into an issue with no sign of solving it. In this guide, I'm going to cover some of the most useful debugging tips I've stumbled across specifically for visual Studio. If you are struggling to fix an issue, these suggestions will hopefully unblock you 🔥🔥🔥
How To Render/Copy All Of An Object Values
This one is really simple, however, is really useful to quickly find the state of an object.

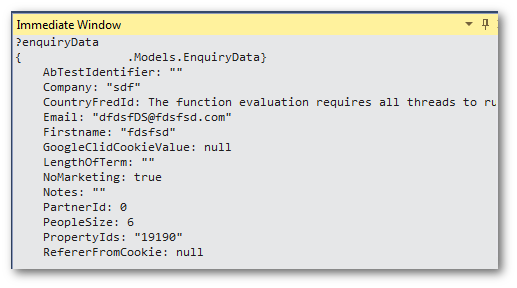
In the immediate window, type in ?[name_of_variable]. You will now see a print out of everything in the object. You can copy the output into notepad, or an IDE to more easily look at it. You can even use the immediate window's logging features to automatically write it to a file 💥
Conditional Breakpoints
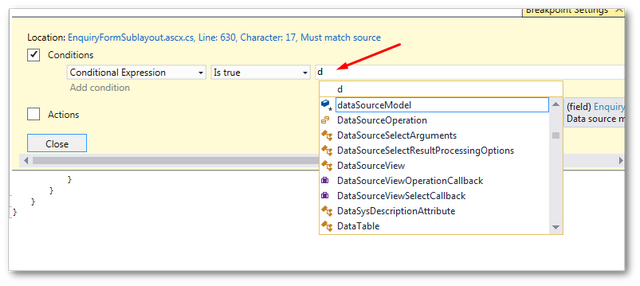
I'm hoping everyone knows how to set a breakpoint. Did you know you can also set conditional breakpoints. A conditional breakpoint will only ever get triggered when some conditional criteria is met. Conditional breakpoints can allow you to whizz through your codebase much quicker. To set a condition breakpoint, set a normal breakpoint, right-click on it and select Condition. The Breakpoint Settings dialog should appear, as seen below:

The cool feature of the conditional breakpoint is that as soon as you typing some statement in the Condition box, Intellisense will pop-up and help you find the variable you want to use. Add the conditional logic and job done 💥.
Quick Debug Attaching
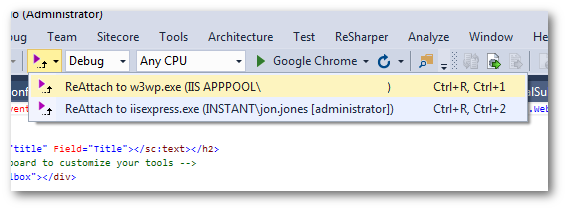
I work with Sitecore CMS regularly which means I need to attach my debugger to a website in IIS rather than the Cassini server. To speed up your development, you should download ReAttach, available from here.

With ReAttach, the first time you want to debug you still need to manully connect to the W3SVC.exe service as normal. After that first time, you can then use ReAttach's dropdown to quickly reconnect to the websites application pool. I genuinely love this plug-in as it saves me lots of uneeded clicking and waiting ❤️
Breakpoint Arn't Just Line Level!
This tip is useful if you want to debug inside a lambda expression. When I started using Visual Studio, I added my breakpoint to the left gutter and assumed that was all I could do. Visual Studio actually allows you to set break-points at a code level. Inside a lambda expression, right-click on the part of the code you want to debug and choose:
Breakpoint ➡ Insert breakpoint
I hope these tips help you get out of trouble. Stumbling on a unsolvable bug is a pain in the ass. The more tools and tricks you have up your sleeve, the higher the chance you will find a fix. Happy Coding 🤘
