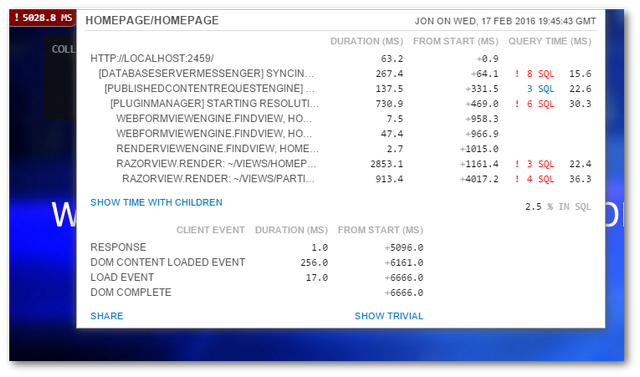
In this tutorial, you will learn some useful debugging tips that will hopefully make tracking down issues within a Umbraco V7 CMS-powered website quicker and less painful. None of us are perfect and when we launch a new website it will contain bugs. Umbraco ships with some useful inbuilt tools that will help you as a developer, to track down these pesky issues a little easier. If you want to learn about them, read on 🔥🔥🔥
Mini-Profiler
Out of the box, Umbraco 7 comes with MiniProfiler installed. Mini profiler is a free package created by the StackOverflow team. As Mini Profiler is installed out-of-the-box, in order to start using it with Umbraco all we need to do is turn it on, simples 😊
To start using MiniProfiler, the first thing you should do is make sure that you have debugging enabled in your web.config. If your website is not set to run in debug mode, MiniProfiler will not work. To anble debug mode, find the line within web.config that looks like this (normally around line 111):
Make sure debug is set to true. In production, you will never want to leave this mode on permanently, so I recommend using web.config transforms to apply this change in production. To make the MiniProfile dashboard appear on your site, you need to add some code into one of your razor views. I recommend adding this snippet within your master layout file:
With debug mode enabled and this code within a view, when you load a page within your website, you should see a little red box in the top left-hand corner like so:

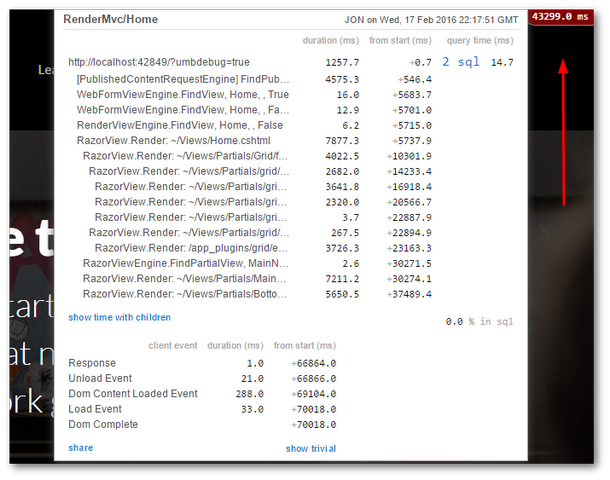
The method above is the sure-fire way of testing that MiniProfile is configured and works correctly. You may be thinking that adding code into your production layout isn't ideal. Luckily there is an easier way to get it working. All you need to do is append ?umbdebug=true to the end of any Url and magically the mini-profiler dashboard should appear:

Sometimes it can be tricky to make the MiniProfile dashboard appear. If you struggle to make this work, try adding this app setting:
This tweak was needed in previous versions of Umbraco, so this might get the dashboard to appear. Another feature that used to work is the umbDebugShowTrace parameter. You used to be able to use ?umbDebugShowTrace=true to enable MiniProfiler. This doesn't work anymore.
With MiniProfiler enabled, open the web page that contains the bug. Using the pages stack request, perform a code walk through all of the actions and methods listed in the report. Add breakpoints everywhere and reload the site using the Visual Studio debugger. Walkthrough the process and look at the data. Following the request back to origin should give you insight into what area of code is not working. When you find the troubled area, it should be much easier to find the root cause of the error 💥
Using MiniProfiler will make debugging issues in Umbraco much easier. It comes out of the box, so why not make use of it. Happy Coding 🤘
